← All projects

Case study · Finance and data engineering

SEC to Excel DCF

Type a ticker and get a full discounted cash flow model in Excel, built from the company's own SEC filings. Every forecast and valuation cell is a live formula, so changing one assumption updates the whole model.

Sample built Oct 22, 2026 with Ensign's $178.35 closing price and 0.66 beta.

Built with
Python, openpyxl
Data
SEC EDGAR XBRL API
Output
8-sheet Excel model
Tests
18, run on every push

The output

A model an analyst can actually work in

Historical columns link to the SEC data, forecast drivers are blue inputs, and everything else is a formula. Formatting follows banking convention.

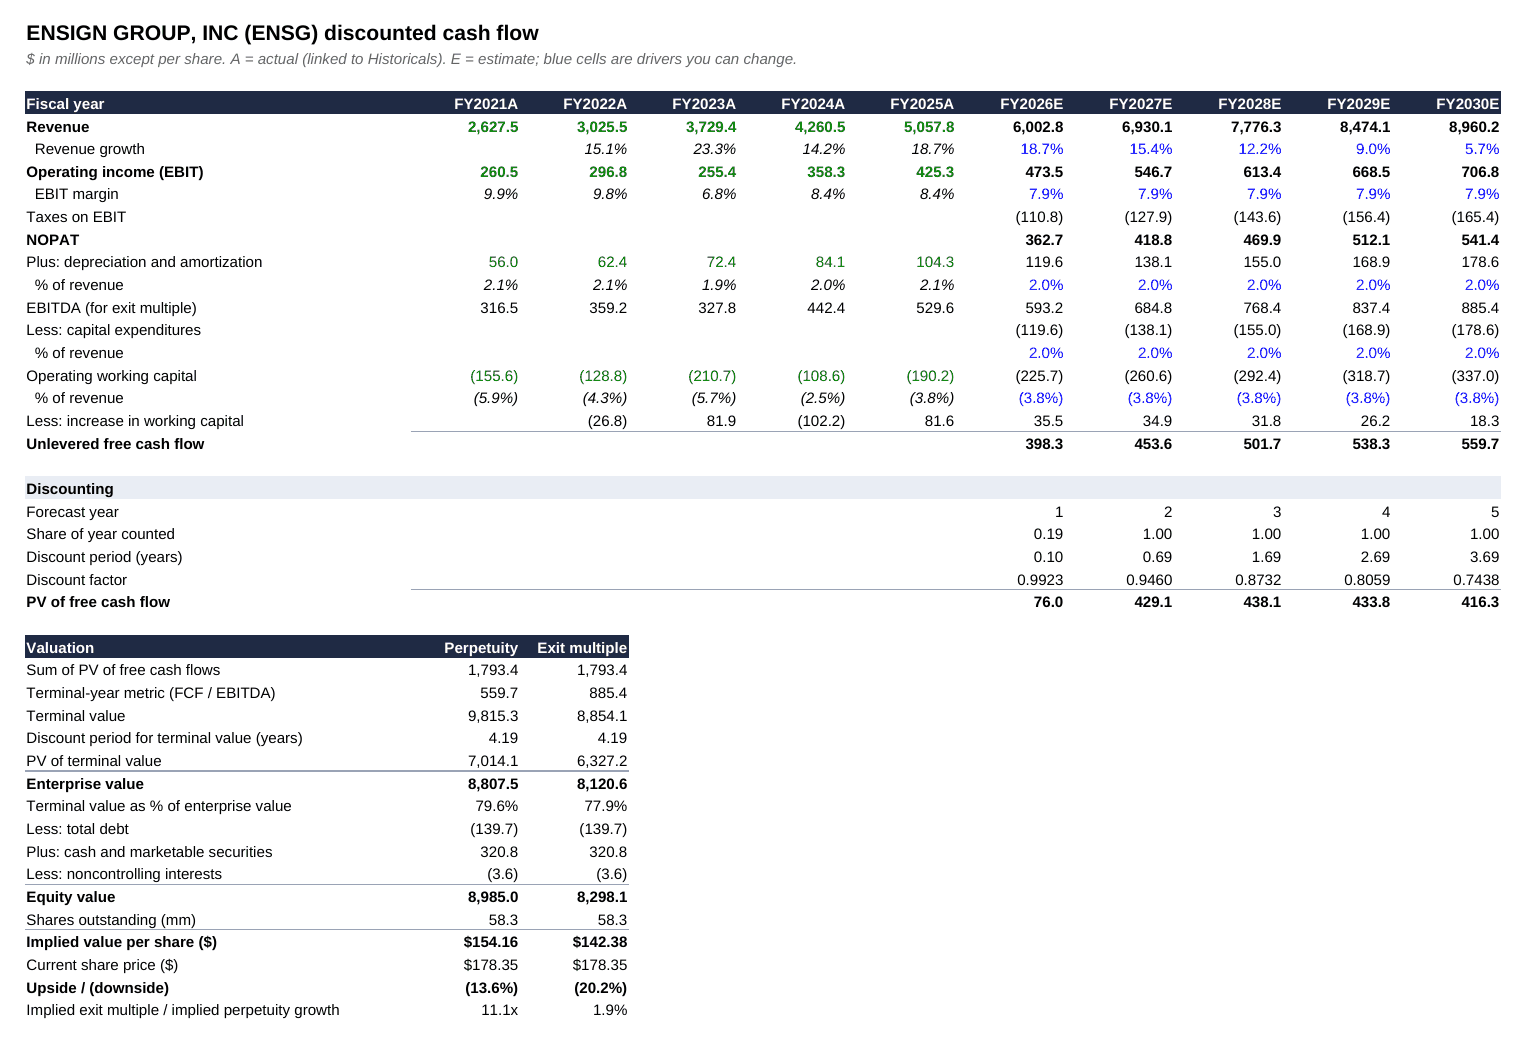
The DCF sheet for Ensign Group: five years of actual revenue, EBIT, D&A, and working capital, a five-year forecast, discounting rows, and a valuation block showing $154.16 per share under perpetuity growth and $142.38 under an exit multiple.
The DCF sheet for Ensign Group. Green numbers link to SEC data, blue numbers are drivers you can change, and black numbers are formulas.
  • SummaryValue per share under two terminal value methods, upside, a sensitivity range, and things to check
  • AssumptionsValuation date, tax rate, terminal growth, exit multiple, and cost of capital, each with a note on how it was set
  • HistoricalsUp to 10 years of statements; hover a number to see its XBRL tag and filing
  • DCFForecast, discounting with a stub period and mid-year convention, and the equity bridge
  • WACCCAPM cost of equity, after-tax cost of debt, and market-value weights
  • SensitivityValue per share across WACC vs. terminal growth and vs. exit multiple
  • SourcesEvery historical number with its tag and a link to the filing on EDGAR
  • NotesMethod, data handling, and limitations

The hard part

The SEC data is free, but it isn't clean

Every number in every 10-K and 10-Q is tagged and published as XBRL. Turning that feed into consistent annual statements took most of the work.

The year field points at the filing, not the period

In the SEC's company facts data, fy is the year of the filing. A FY2025 10-K also reports FY2023 and FY2024, and all three carry fy=2025.

Fix: ignore fy and match every number on its period end date, keeping only 10-K figures that cover 340 to 380 days.

Old years get restated

The same period shows up in several filings, sometimes with different values after a restatement.

Fix: the most recently filed value wins, and each number keeps its accession number so you can trace it.

Companies label the same line differently

Revenue alone has at least six common tags, and companies switch over time. Ensign moved its capex to a company-specific tag after 2019, which the SEC's standardized feed leaves out.

Fix: a ranked list of tags for each line, the largest value for revenue, derived values where a line is missing, and a clear warning when the tool falls back.

Debt is split in different ways

Some companies report current and long-term debt separately. Others report a total that already includes the current portion.

Fix: assemble debt from its parts based on which layout the company uses, so nothing is counted twice.
Testing on real companies

What running it on four real companies caught

I ran the first version on Ensign, Apple, Costco, and Procter & Gamble and checked the output against their filings. The math held up. The default assumptions didn't.

ProblemBeforeAfterFix
Apple's debt weight in WACC57%3%Buybacks have shrunk Apple's book equity, so book weights were badly off. With no share price entered, the tool now uses the public float from the 10-K cover as market value.
Cost of debt for Costco and P&G3.0%5.1%Old low-coupon bonds put the cost of debt below the 10-year Treasury. New debt can't cost less than the risk-free rate, so that's now the floor.
Apple's long-term securities$0$84bnThe equity bridge counted only cash and short-term investments. Long-term marketable securities add about $5.80 a share.
Ensign's capexmissingflaggedNo standard tag exists after 2019. Capex now defaults to D&A, and the Summary sheet says so plainly.

0

formula errors across all four workbooks after recalculating in LibreOffice

Exact

match between the Excel formulas and an independent Python version of the model, checked by a test on every push

4

companies run end to end, with revenue and operating income spot-checked against their reported figures

About the Ensign sample

  • It uses the tool's defaults: growth starts at Ensign's 3-year revenue CAGR and fades toward 2.5%, and margins, D&A, and working capital follow recent history.
  • Capex is set equal to D&A because Ensign's capex isn't in the standardized data.
  • The 10.0x exit multiple is a generic placeholder, flagged in yellow in the workbook.
  • It shows what the tool produces. It isn't a view on the stock.

What's next

Where it goes from here

  • REIT modeFFO and AFFO, price-to-FFO comparisons, and net asset value from a cap rate, for companies like Omega, Sabra, and CareTrust.
  • Trailing twelve monthsBuild the base year from the latest 10-Qs instead of the last 10-K.
  • Peer multiplesReplace the placeholder exit multiple with comparable companies.